Compass Staff |
The world is experiencing a level of disruption and business risk not seen in generations. Some companies freeze and fail, while others adapt, innovate, and even thrive. The difference is resilience. And one key to resilience, according to a research study released today by Guild and Lightcast, is workforce mobility.
The study, “The Talent Resilience Index (TRI),” identified workforce mobility — the ability of workers to adapt, move, and evolve to fill in-demand jobs — as one of the clearest indicators yet of resilience in action, and a key contributor to economic growth.
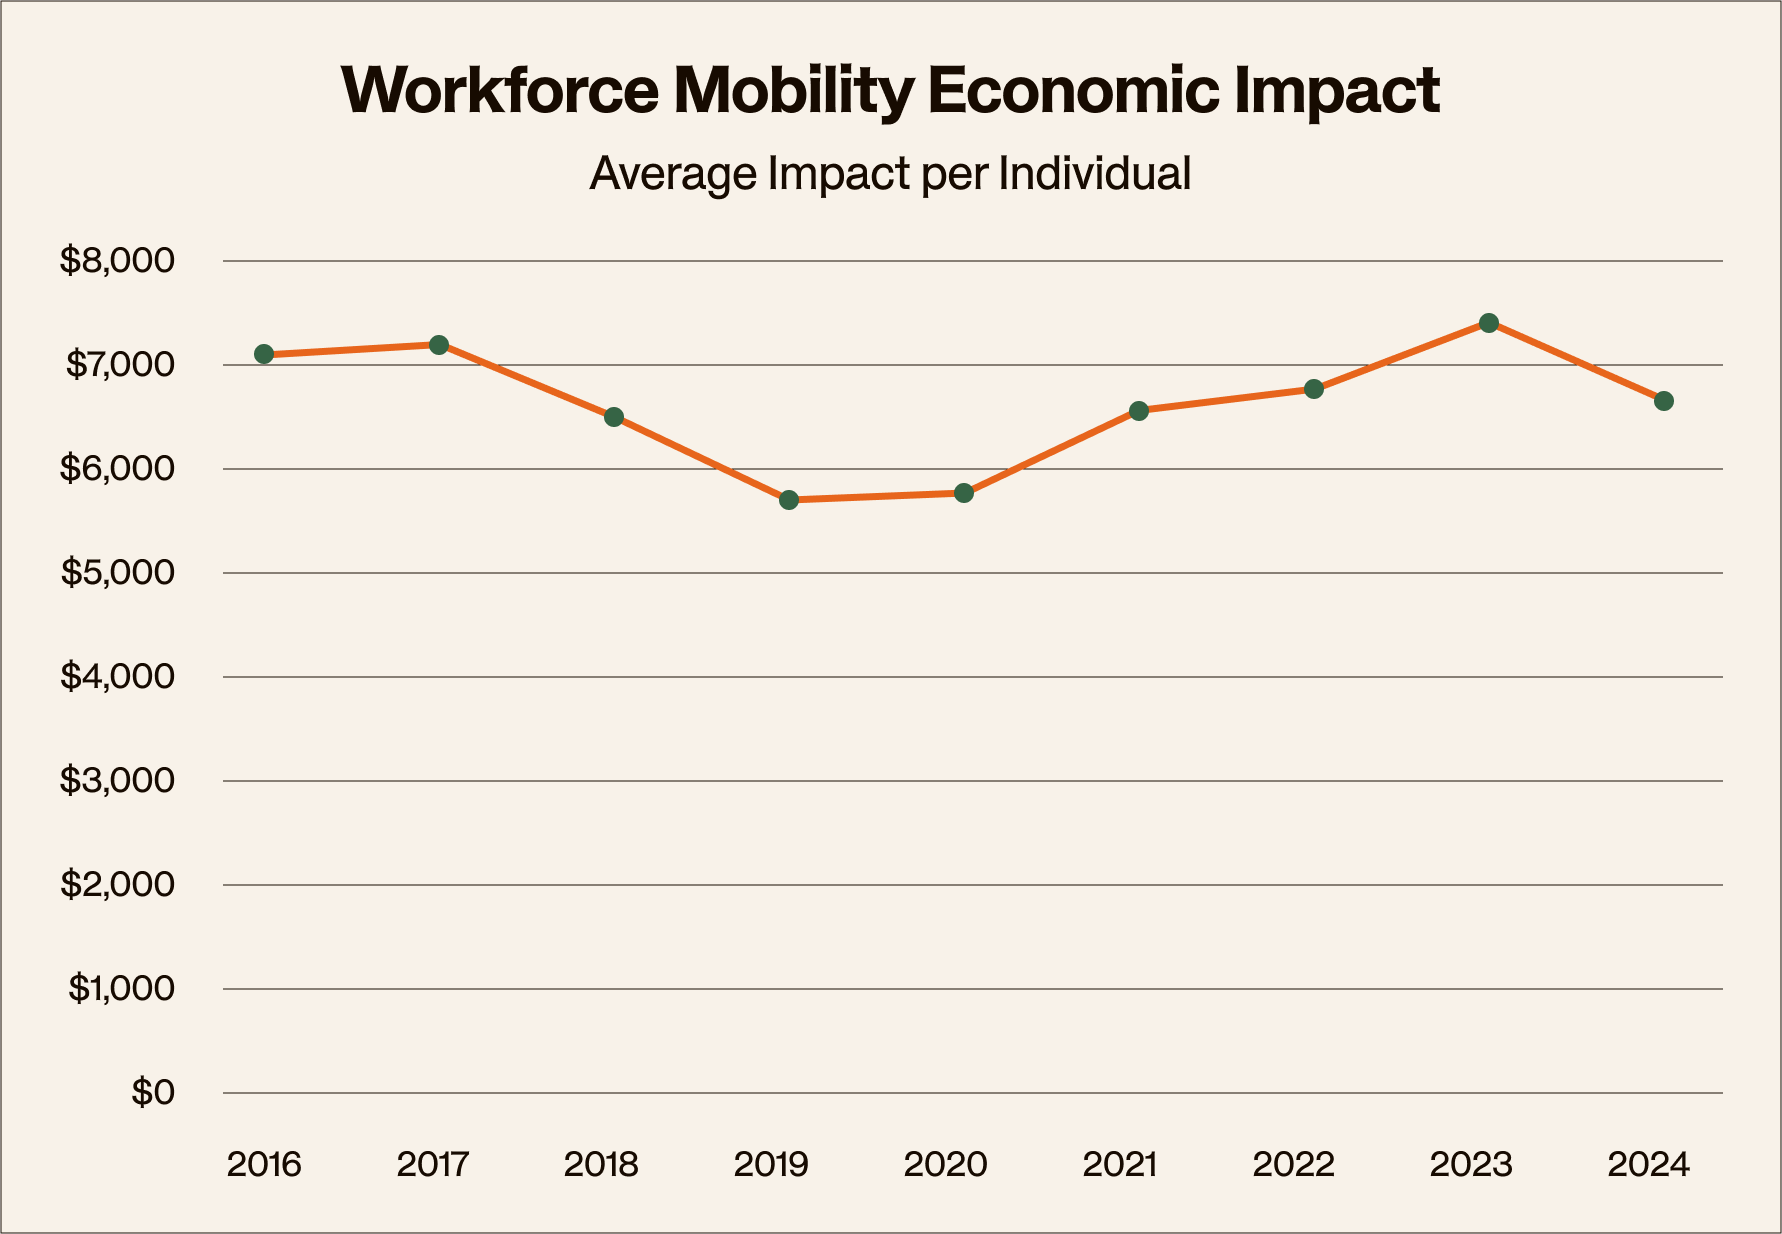
In dollar terms, workforce mobility generated an average of $221 billion in additional annual individual earnings between 2016 and 2024 — equivalent to 1% of U.S. GDP — peaking at $255 billion in 2023, the report found. Workers experiencing mobility, meanwhile, see an average 15% annual earnings increase — roughly a $7,000 per capita boost compared with the U.S. median salary of $47,000 — more than triple a typical merit raise and outpacing inflation.
Yet, despite the clear economic upside, workforce mobility at its lowest point since 2016. One reason comes down to a disconnect.
In 2024, mentions of the term “resilience” in quarterly earnings calls by Fortune 500 executives surged by more than 200% compared with 2019, according to the World Economic Forum.
While leaders across sectors recognize that resilience matters, few have linked it to workforce mobility, and even fewer know how to define, measure, and build resilience in the context of their current workforce. There is no shared understanding of which jobs and skills are most future-proof, where workforces stand today, and what actions will ensure readiness for tomorrow.
Without these insights, businesses risk stalled productivity, workers risk stagnant earnings and losing opportunities for growth, and policymakers risk eroding global competitiveness. To move forward, organizations need a shared language and common lens for what resilience actually looks like in practice and how to measure it, set goals, invest where it counts, and track progress.
A shared language for resilience
To create that roadmap, we first need clear definitions:
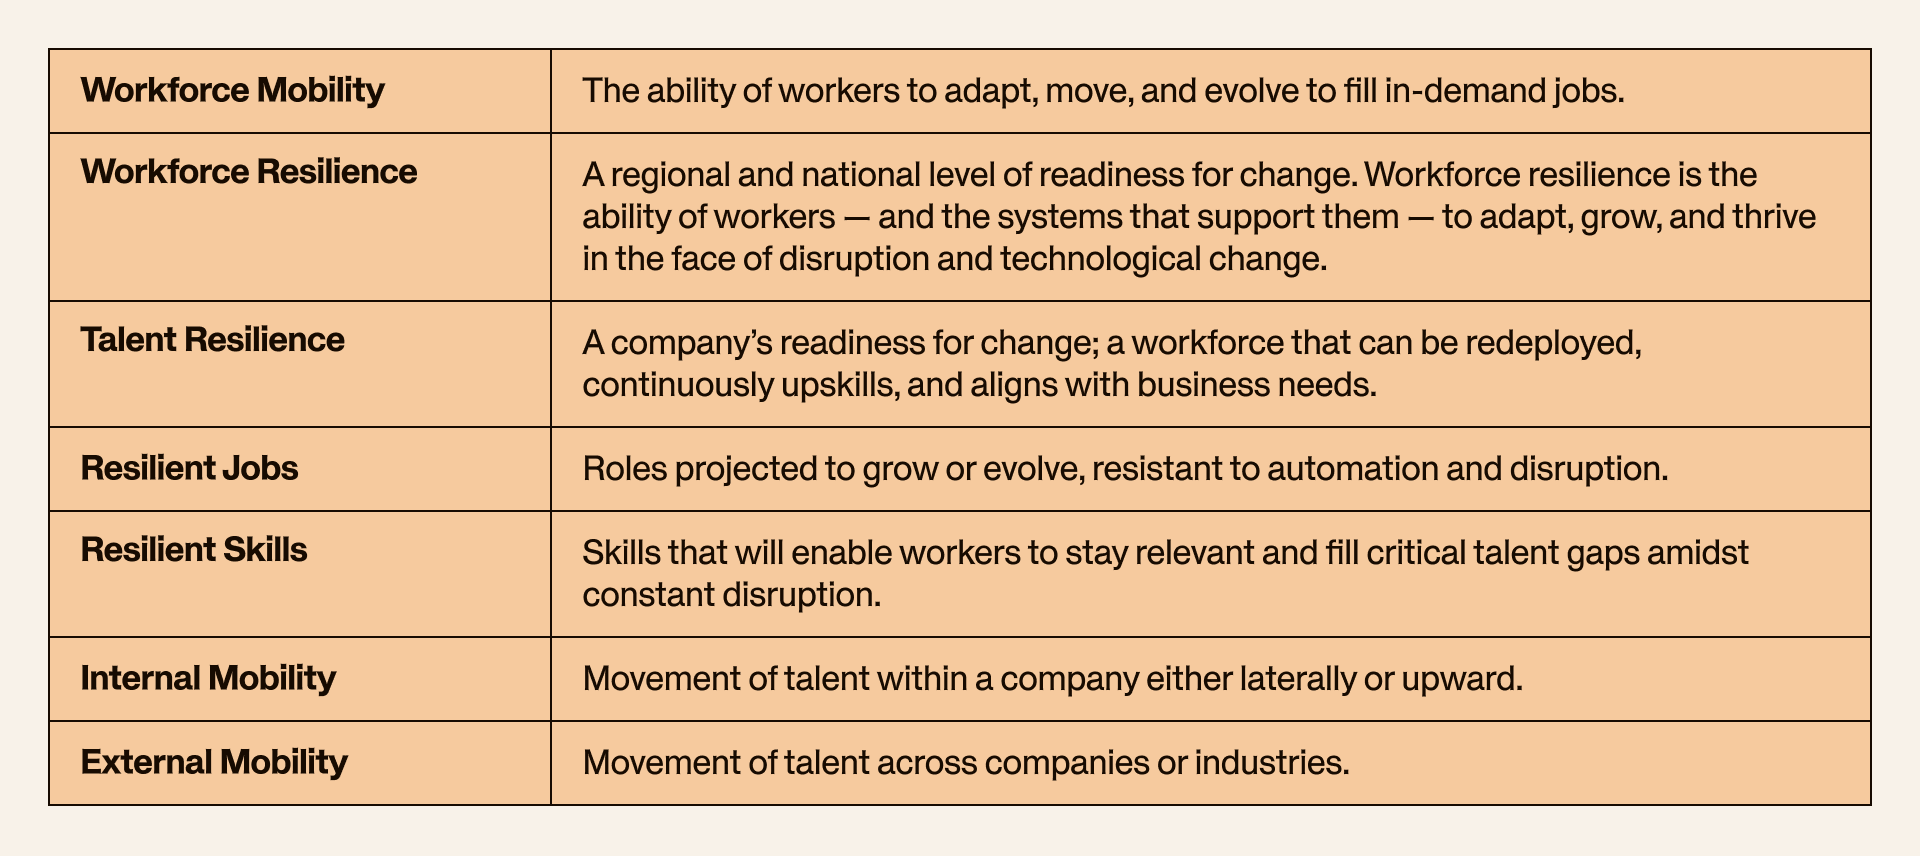
The TRI lens: Activity × impact
With foundational definitions, Guild and Lightcast’s Talent Resilience Index (TRI) gives leaders a practical way to manage resilience by splitting mobility into two things they can influence: how much mobility happens (activity) and what it yields (impact). The TRI quantifies resilience by combining seven variables into two weighted measures that add up to 100%.
Mobility Activity: The frequency and intensity of lateral or upward career moves occurring across the U.S. labor market each year.
Internal (within the same organization) / Promotions within the same occupation (20%)
Internal Occupation Change (20%)
External Occupation Change (15%)
External Employer Changes Within the Same Occupation (5%)
Mobility Impact: The economic and personal value generated by those mobility events, measured through income gains, industry shifts, and geographic movement.
Economic Mobility (20%): Increases in worker earnings and standards of living as a direct result of workforce mobility.
Industry Mobility (15%): Transitions across industries.
Geographic Mobility (5%): Career-driven migrations and region transitions.
How TRI translates inside your organization
The TRI, at its core, is a national view of workforce mobility. Inside a single company, the next practical move is to translate the TRI’s activity × impact logic into a focused “mini-TRI” you can manage.
The key is to first use the TRI as a benchmark and a set of levers, then translate it to the organizational level. (For example, “industry mobility” becomes redeploying talent across business units, and macro “income gains” becomes earnings progression and productivity after internal moves.) The payoff is a simple company-level diagnostic and operating routine that keeps the TRI’s activity x impact logic while focusing only on levers leaders actually control. Here’s how:
1. Baseline
Start with a one-page scorecard that shows activity (how often people move inside your company versus being hired from the outside) and impact (what those moves deliver in earnings, retention, and speed to productivity). Track progress over time with a simple index (the TRI uses 2018 = 1.0 as its baseline), and benchmark your internal share against the national pattern (only about 9% of moves happen internally today) so you can spot “stuck lanes.” Two guideposts highlighted in the TRI make the case for shifting the mix: any mobility is associated with an average ~15% earnings lift, and internal movers stay 60–65% longer than external hires.
2. Set targets
Pick 2–3 components to move over the next year, set quarterly checkpoints, and tie goals to strategy (e.g., AI adoption, time-to-fill, cost to hire). Lean into internal mobility where you’re under-invested — the retention lift alone (60–65% longer tenure for internal movers) compounds resilience and reduces replacement costs.
3. Invest in the weakest levers
Focus on the bottlenecks you control: Make advancement rules clear, make it easy for people to move across teams, and tie progression to skills so mobility delivers real gains in pay and performance. Aim these efforts at roles and capabilities with staying power — the ones the TRI identifies as most resilient.
4. Govern & track
Make the diagnostic part of your quarterly business reviews: Review targets vs. actuals, track lead indicators (activity components, internal/external mix) alongside lag indicators (earnings lift for movers, internal fill, retention, vacancy days), and reinforce progress by tying leader incentives to measurable mobility outcomes. Treat the TRI as the roadmap/benchmark — and your micro-TRI as the operating system you can actually manage.
The resilient jobs and skills of the future
With a mini-TRI in place, the next question is where to aim your mobility and skills investment. The TRI’s jobs-and-skills analysis highlights the roles and capabilities most likely to hold value—your roadmap for targeting pathways, redeployments, and learning spend.
AI is an enabler: While AI often gets framed as a replacement for human work, TRI shows that it can actually increase job resilience—provided workers are equipped with the skills to use it.
Healthcare is critical and constrained: Demand is soaring, while the population ages—making it the most resilient and fastest growing sector.
Geography matters: Some of the fastest-growing, most resilient roles, such as truck and bus drivers, are inherently localized, creating unique opportunities for place-based workforce resilience strategies.
Human-centered roles endure: Jobs requiring critical thinking, emotional intelligence, and legal judgment resist automation.
Blended skillsets will define the future: The most future-proof skills are hybrids—solution sales, patient education, AI diagnostics, and architecture-level software design—integrating human and technical strengths.
The new core of business: Process improvement, strategy, cloud, and solution engineering are becoming the backbone of organizational adaptability in an AI-driven economy.
Precision medicine is on the rise: Advanced specialties like oncology, medical imaging, and nuclear medicine are growing as diagnostic and treatment technologies accelerate.
The ROI of resilience for workers
The definition of success in today’s labor market is shifting. Stability and linear career progression alone are no longer the benchmarks. Success today is measured by growth — the ability to evolve through skills that remain in demand, to adapt as the economy transforms, and to step into roles that expand long-term opportunity. Workers who experience mobility see a 15% annual earnings increase — roughly a $7,000 per capita boost compared to the U.S. median salary of $47,000 — more than triple a typical merit raise and outpacing inflation. These gains are tied to skill acquisition and transitions into resilient roles.
Where do we go from here?
As the research shows, workforce resilience requires intentional investment in skill development, internal mobility, and equitable access to opportunities. Employers who embrace this strategy will cultivate adaptable, engaged employees. Workers who actively develop future-resilient skills will thrive in a dynamic labor market. And policymakers who support scalable, data-driven pathways will strengthen U.S. competitiveness.